SINDy(Sparse Identification of Nonlinear Dynamics) Application
SINDy Application for Statistical Analysis and Visualization of Bioaerosol Concentration Data
Project Description
- Motivation: To automatically calculate and visualize measured bioaerosol concentration data.
- Goal: To discover governing equations from time-series data, particularly identifying the underlying dynamical system that generates the observed data.
Contribution
Programming
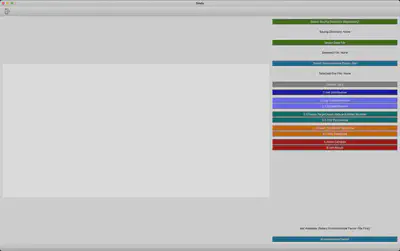
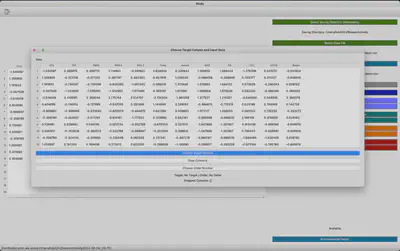
- Methodology: Developed software using Python and the PyQt5 library.
- Features: The application includes 10 key features, each implemented through specific Python functions:
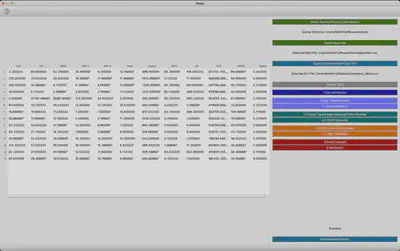
- Importing and Displaying csv data
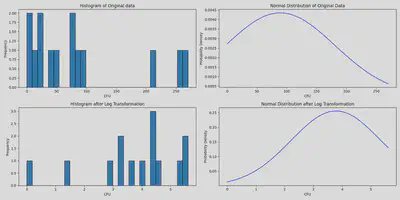
- Log Transformation
- Standardization
- Target, input data, and order number selection
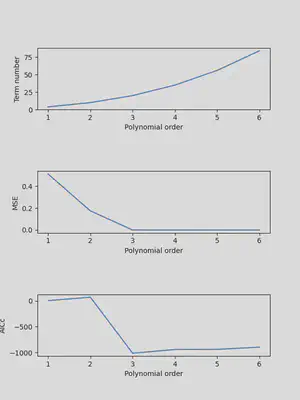
- Plotting polynomial functions
- Inserting threshold parameters
- Plotting threshold functions
- Inserting lambda values
- Generating the final data equation
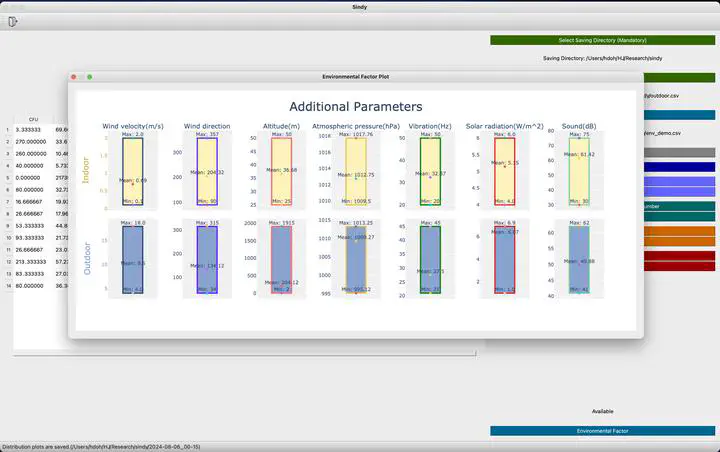
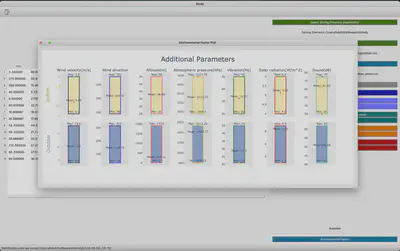
- Visualization: Implemented using the Matplotlib library
Skills
- Python: Data calculation, analysis, and visualization.
- Matplotlib: Visualization
- PyQt5: Python-based GUI development
Hyungjun Doh
Master’s Student
My research interests are Human-AI interaction and its practical applications, with a specific focus on Extended Reality, Task Guidance Systems, and AI-infused interfaces.